 LinkedIn


Buoyant Blog
Network Monitoring with the Linkerd Service Mesh


Relevant articles:


Michael Levan
September 8, 2023
Guest post by Michael Levan
In my previous two blog posts, I introduced the Linkerd service mesh and showed you how to deploy it in Azure, AWS, or GCP. Now that we understand what a service mesh is and why you need one, and have deployed it in our environment, we'll focus on a core day two concern: how to effectively monitor your network with the CNCF-graduated service mesh.
A service mesh is key to ensuring network, security, and reliability success. Without one, you can't really understand what’s happening inside your cluster at a network layer. You'd be basically deploying applications while flying blind. Service meshes provide deep insights into cluster health, providing powerful observability capabilities. Seems like a no-brainer, right? So, let's dive right into it!
Prerequisites
To get started, be sure to have the following available:
- Kubernetes cluster: It can run locally (e.g., Minikube or Kind) or you can use a managed Kubernetes cluster (e.g., AKS, EKS, GKE).
- Linkerd installed. For instructions on how to do that, follow the Linkerd getting started guide.
Linkerd and app deployment
To see the power of Linkerd's monitoring capabilities in action, you'll need various microservices. The Sockshop demo app is a great option and includes various Kubernetes resources. You can find the Sockshop repo. Now, let’s deploy it.
First, clone the Sockshop application repository.
git clone https://github.com/microservices-demo/microservices-demoChange the directory (cd) into the microservices-demo directory.
cd microservices-demo
Then, change the directory to the Kubernetes deployment directory.
cd deploy/kubernetesThe Sockshop demo expects to be installed in the sock-shop Namespace, so we need to create that.
kubectl create namespace sock-shop
Lastly, deploy the Sockshop application.
kubectl apply -f complete-demo.yaml
You should now see a similar output to this on the terminal.
deployment.apps/carts created
service/carts created
deployment.apps/carts-db
service/carts-db
deployment.apps/catalogue
service/catalogue
deployment.apps/catalogue-db
service/catalogue-db
deployment.apps/front-end
service/front-end
deployment.apps/orders
service/orders
deployment.apps/orders-db
service/orders-db
deployment.apps/payment
service/payment
deployment.apps/queue-master
service/queue-master
deployment.apps/rabbitmq
service/rabbitmq
deployment.apps/session-db
service/session-db
deployment.apps/shipping
service/shipping
deployment.apps/user
service/user
deployment.apps/user-db
service/user-db
It will take a few minutes for the sock shop to be running; you can run the following Kubectl command to wait for it:
kubectl rollout status -n sock-shop deployment Once it’s all ready, let’s take a look inside the sock-shop namespace:
kubectl get pod,service -n sock-shopYou should see many Pods and Services, something like:
NAME                              READY  STATUS   RESTARTS  AGE
pod/carts-7bbf9dc945-2t72m        1/1    Running  0         6m
pod/carts-db-67f744dd5f-krndw     1/1    Running  0         6m
pod/catalogue-6479dbb5bd-2bw24    1/1    Running  0         6m
pod/catalogue-db-655d8cdb7-dmtk5  1/1    Running  0         6m
pod/front-end-7f5c844b4c-vrwnw    1/1    Running  0         6m
pod/orders-7465597c5-d77zr        1/1    Running  0         6m
pod/orders-db-b76d8c54c-wjjsj     1/1    Running  0         6m
pod/payment-c7df5b49-7d4w2        1/1    Running  0         6m
pod/queue-master-9fc44d68d-hcvnm  1/1    Running  0         6m
pod/rabbitmq-6576689cc9-k9mw2     2/2    Running  0         6m
pod/session-db-695f7d48f-xc291    1/1    Running  0         6m
pod/shipping-79c568cddc-9td4m     1/1    Running  0         6m
pod/user-79dddf5cc9-gmfrk         1/1    Running  0         6m
pod/user-db-b8dfb847c-s5fwv       1/1    Running  0         6m

NAME                  TYPE       CLUSTER-IP    EXTERNAL-IP  PORT(S)            AGE
service/carts         ClusterIP  10.0.165.223  <none>       80/TCP             6m
service/carts-db      ClusterIP  10.0.184.150  <none>       27017/TCP          6m
service/cataloque     ClusterIP  10.0.106.243  <none>       80/TCP             6m
service/catalogue-db  ClusterIP  10.0.31.70    <none>       3306/TCP           6m
service/front-end     NodePort   10.0.19.18    <none>       80:30001/TCP       6m
service/orders        ClusterIP  10.0.248.231  <none>       80/TCP             6m
service/orders-db     ClusterIP  10.0.25.7     <none>       27017/TCP          6m
service/payment       ClusterIP  10.0.37.81    <none>       80/TCP             6m
service/queue-master  ClusterIP  10.0.16.85    <none>       80/TCP             6m
service/rabbitmq      ClusterIP  10.0.16.85    <none>       5672/TCP,9090/TCP  6m
service/session-db    ClusterIP  10.0.104.5    <none>       6379/TCP           6m
service/shipping      ClusterIP  10.0.143.148  <none>       80/TCP             6m
service/user          ClusterIP  10.0.49.101   <none>       80/TCP             6m
service/user-db       ClusterIP  10.0.176.208  <none>       27017/TCP          6m
Note that most Pods have only one container (with the exception of the rabbitmq Pod). Go ahead and inject Linkerd’s sidecar into the Deployment Pods, so they’re fully managed by the service mesh:
kubectl get deploy -o yaml -n sock-shop | linkerd inject - | kubectl apply -f -
Again, it will take a few minutes for everything to be ready again, so rerun:
kubectl rollout status -n sock-shop deployment
Once that’s done, you can re-fetching the Pods, and you’ll see an additional container in each Pod — that's the Linkerd sidecar.
kubectl get pods -n sock-shop
NAME                              READY  STATUS   RESTARTS  AGE
pod/carts-7bbf9dc945-2t72m        2/2    Running  0         8m
pod/carts-db-67f744dd5f-krndw     2/2    Running  0         8m
pod/catalogue-6479dbb5bd-2bw24    2/2    Running  0         8m
pod/catalogue-db-655d8cdb7-dmtk5  2/2    Running  0         8m
pod/front-end-7f5c844b4c-vrwnw    2/2    Running  0         8m
pod/orders-7465597c5-d77zr        2/2    Running  0         8m
pod/orders-db-b76d8c54c-wjjsj     2/2    Running  0         8m
pod/payment-c7df5b49-7d4w2        2/2    Running  0         8m
pod/queue-master-9fc44d68d-hcvnm  2/2    Running  0         8m
pod/rabbitmq-6576689cc9-k9mw2     3/3    Running  0         8m
pod/session-db-695f7d48f-xc291    2/2    Running  0         8m
pod/shipping-79c568cddc-9td4m     2/2    Running  0         8m
pod/user-79dddf5cc9-gmfrk         2/2    Running  0         8m
pod/user-db-b8dfb847c-s5fwv       2/2    Running  0         8m
Viz, Linkerd's default monitoring tool
Now that we deployed the Sockshop application, let's monitor it with Viz — Linkerd's built-in monitoring tool. Viz allows you to see all service mesh resources and provides deep insights into each pod (more to that, in the next section). So let's get it installed.
Installing Viz
To install Viz, use the Linkerd CLI with the following command:
linkerd viz install | kubectl apply -f -
linkerd viz check
You’ll need to restart the sock-shop deployments for the full benefit of Linkerd Viz:
kubectl rollout restart -n sock-shop deployment
kubectl rollout status -n sock-shop deployment
Finally, launch a browser to look at the Viz dashboard. This actually starts a port-forward, which is why we’re running it in the background:
linkerd viz dashboard &
Monitoring
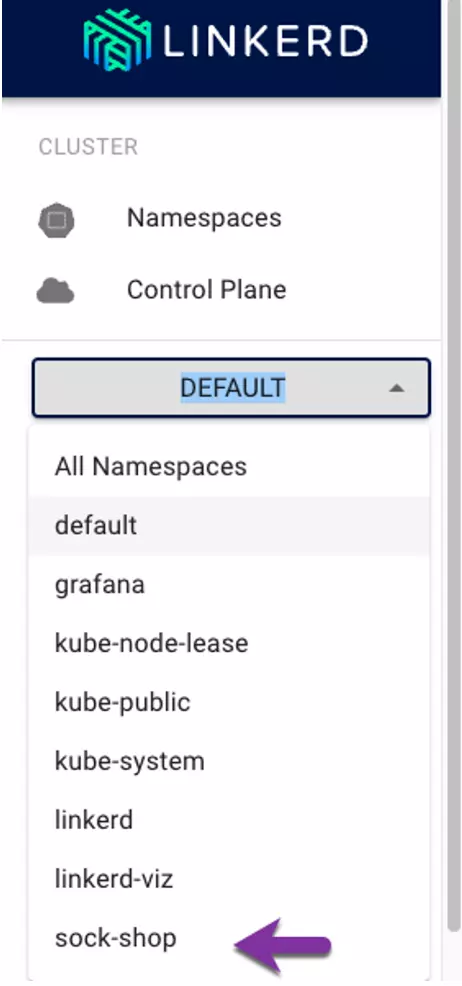
Once Viz is installed and running, we can use it to observe the meshed resources. On the Linkerd Viz dashboard, click the Namespace section and select the sock-shop Namespace.
Under the HTTP metrics section, you’ll see the sock-shop Namespace. Click on it.
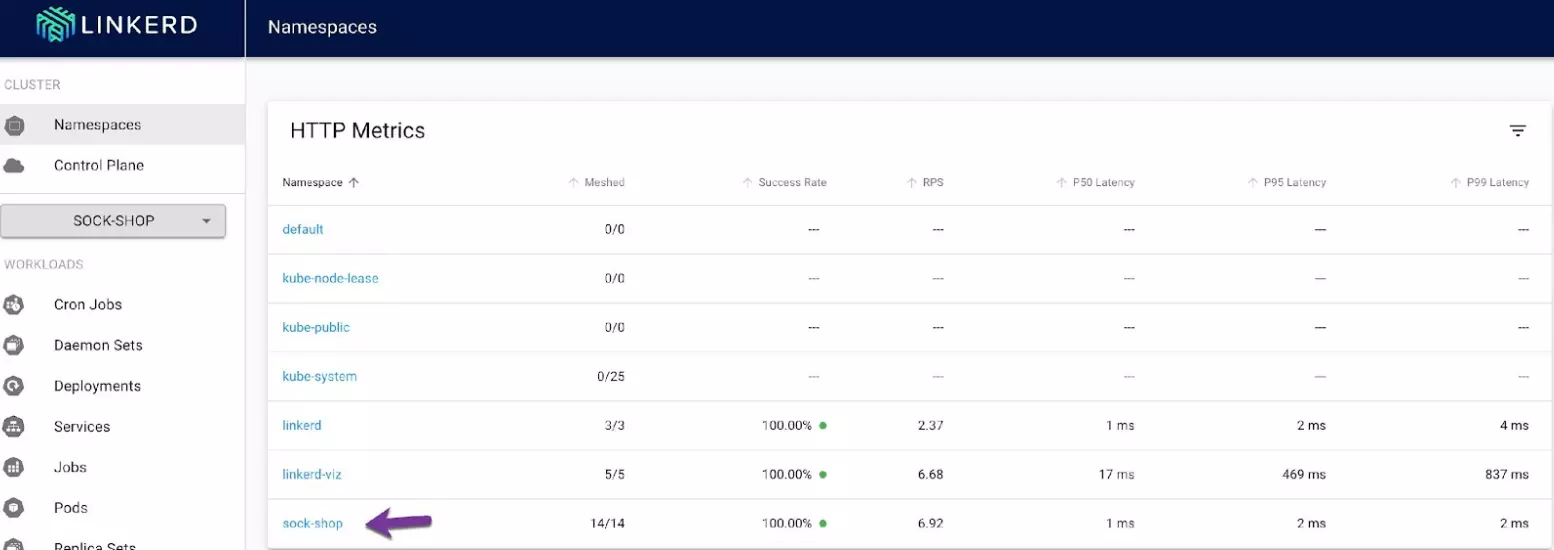
As you can see, all Deployments within the sock-shop Namespace are now successfully meshed. You can also see the success rate and latency of each Deployment.
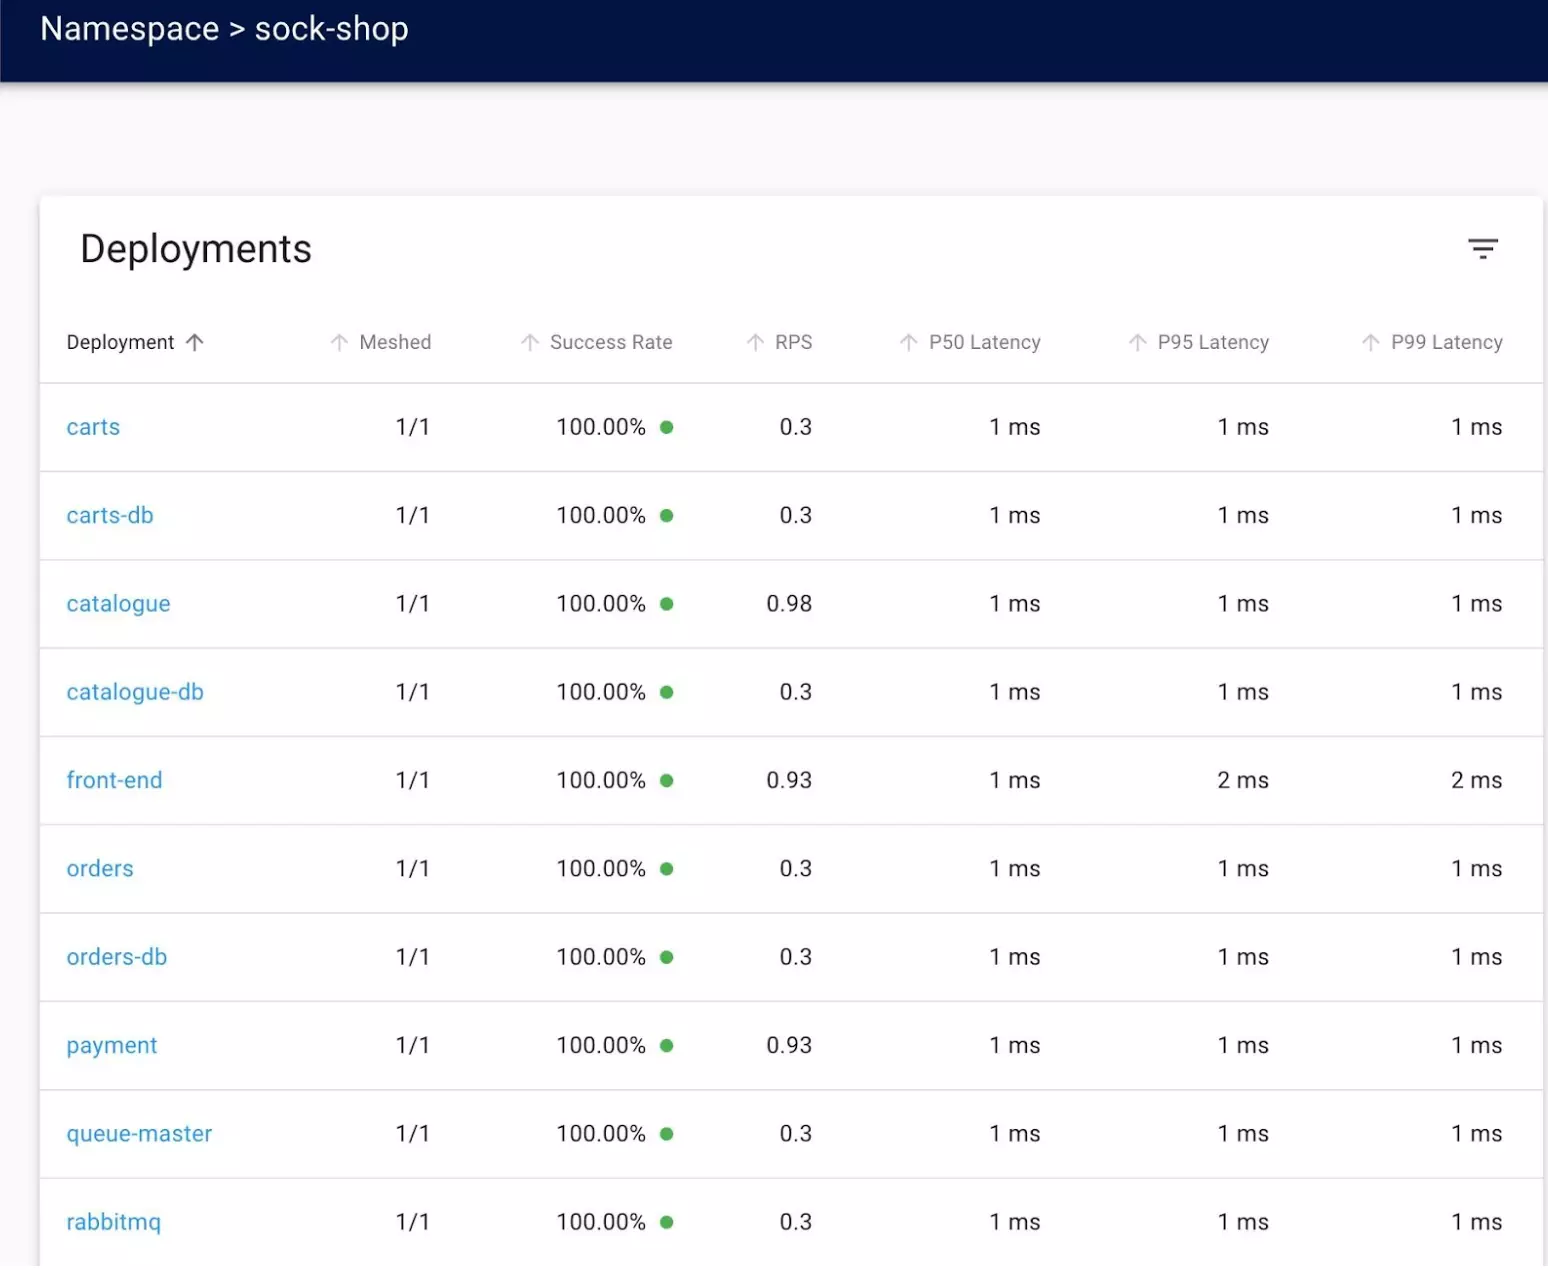
Let's see what else we can find out about a particular deployment. Click on the Carts Deployment. Now we can see the success rate and latency for each service within that pod.
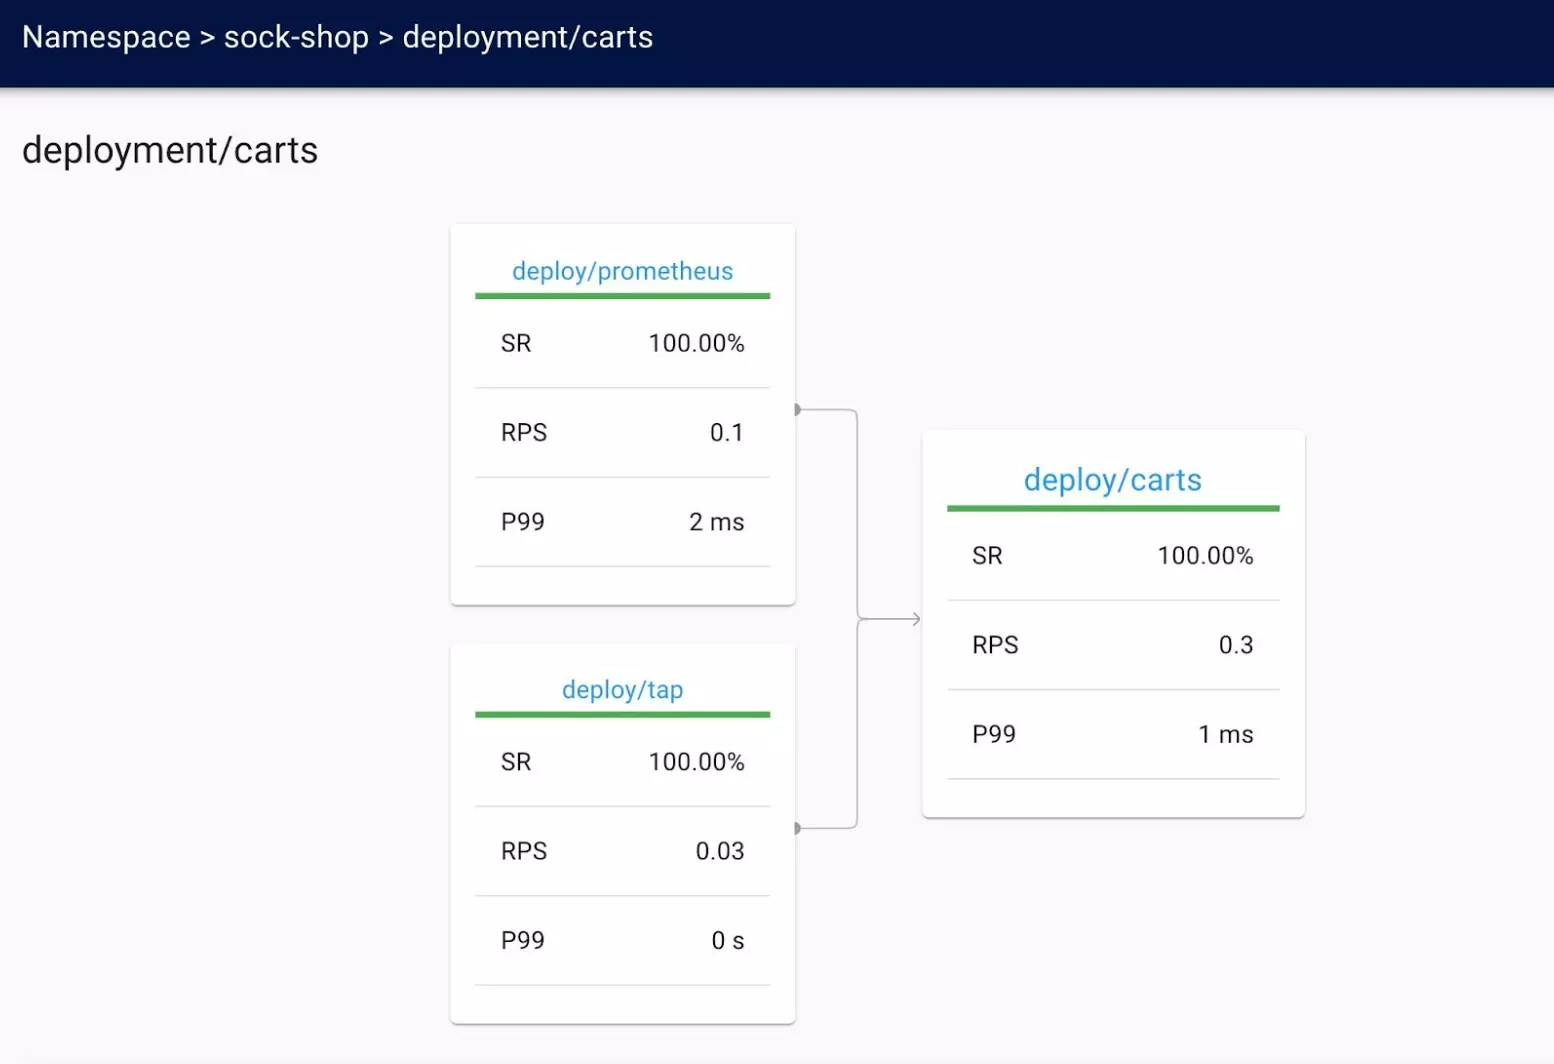
On the same page, scroll down, and you'll see inbound and outbound routing to the Deployment. This allows you to understand what's happening within the pod network of your application. Understanding what's “talking to” your app from a networking perspective, is crucial for troubleshooting and understanding pod communication.
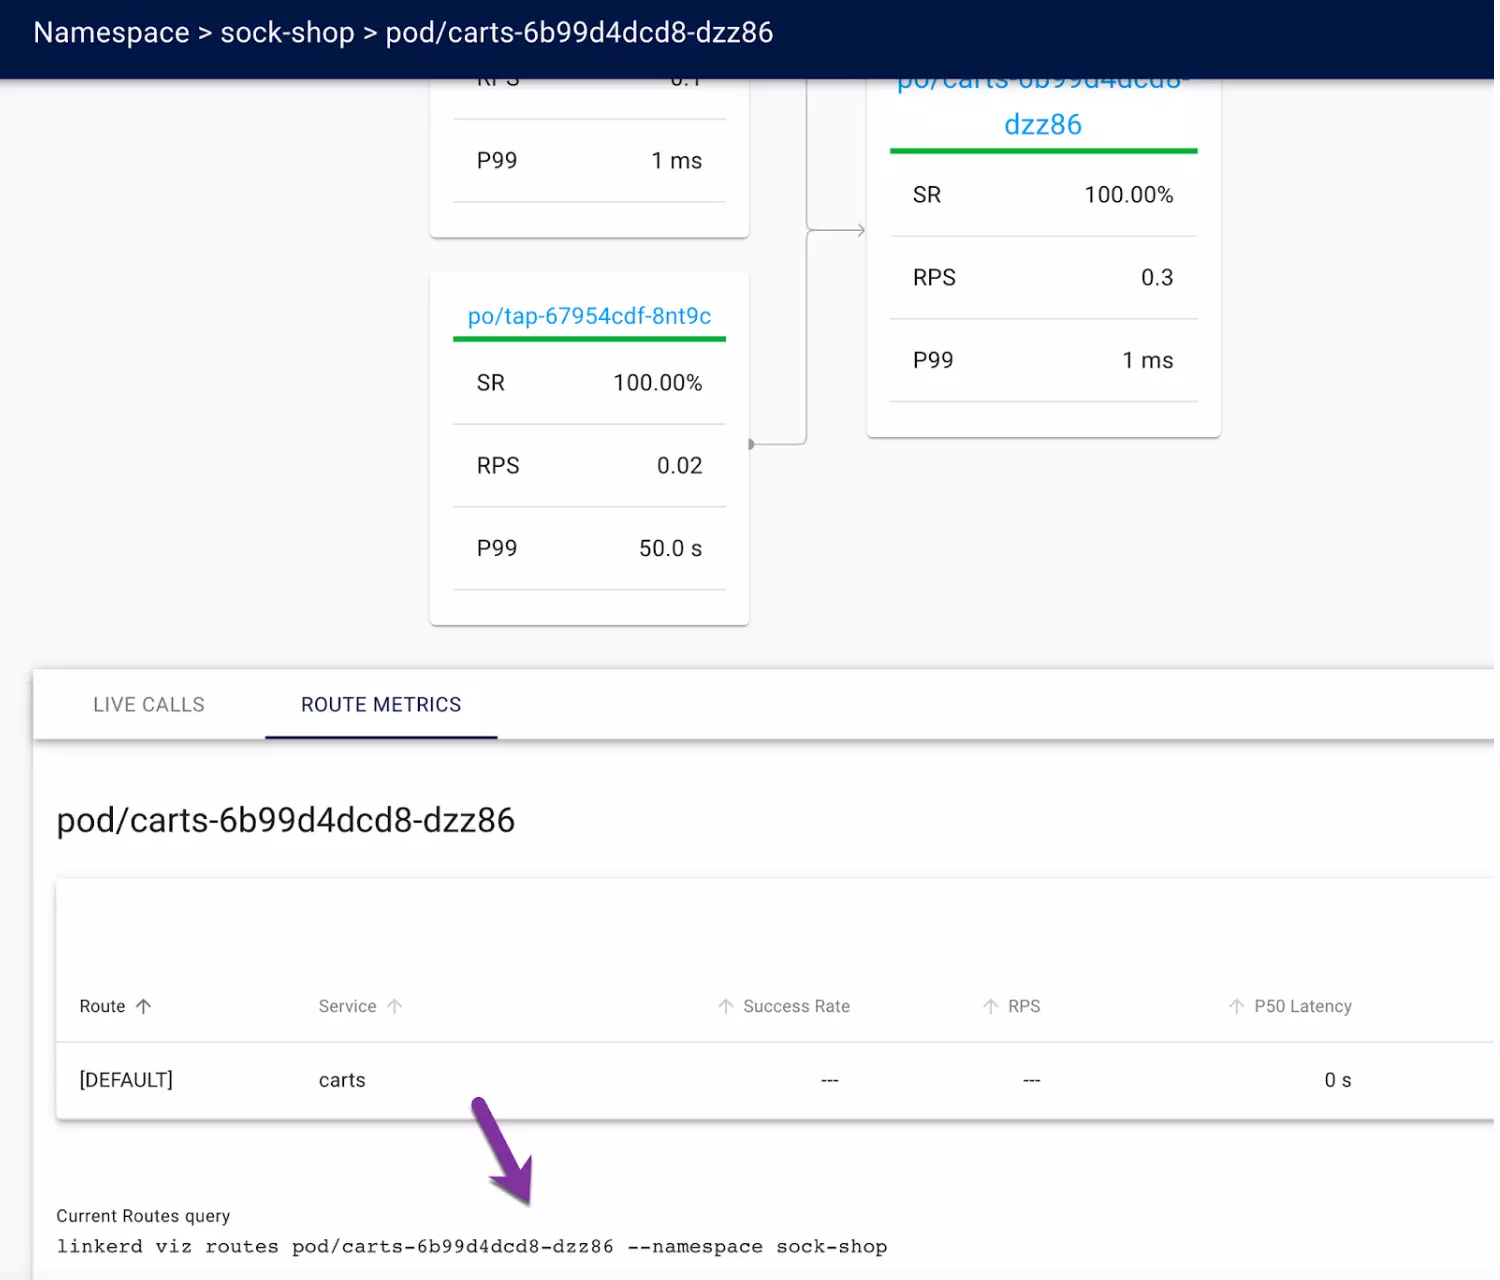
Let's dive a little deeper. Click on the Cart Pod.
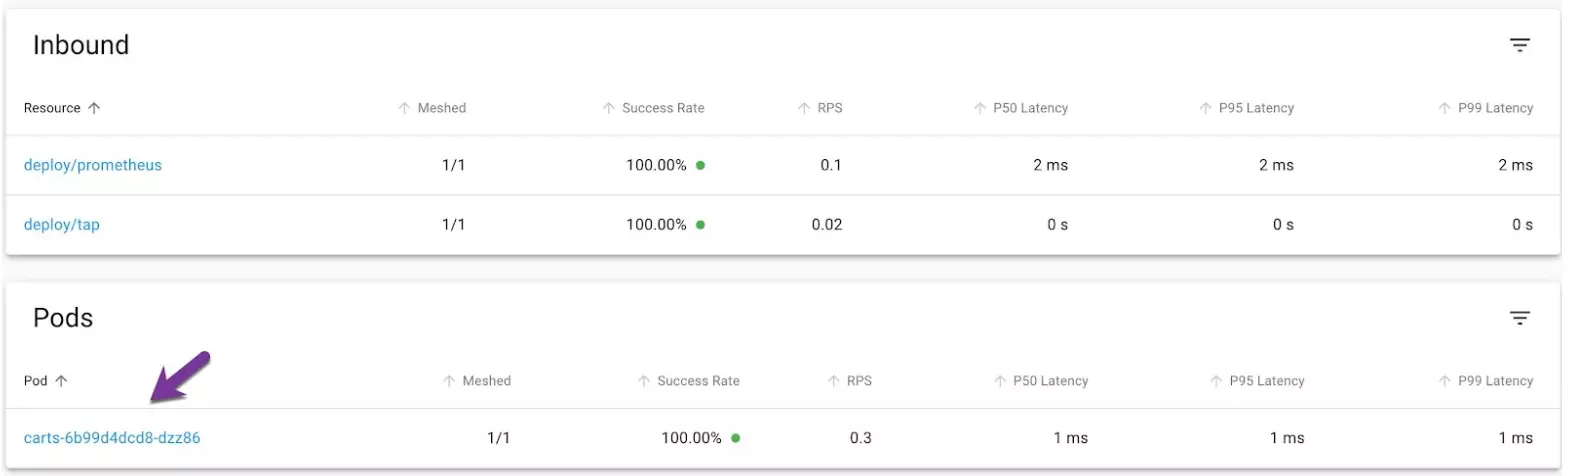
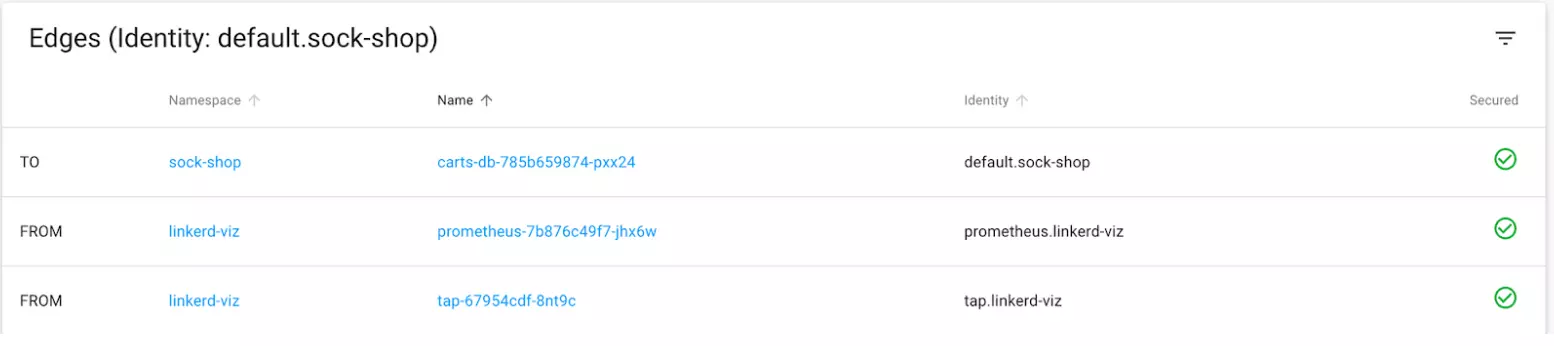
Now you'll see communication flow to and from the pod, both inbound and outbound. If you look at the Edges display, toward the bottom, you can see markers on the right side of the page that show that mTLS is actually happening.
For a deeper look into the various application routes, use the linkerd viz routes command.
The Linkerd Viz dashboard has a lot of great features, but it’s not great for long-term monitoring, and it’s not very customizable. For production scenarios, you’ll want a monitoring tool that keeps historical data about your environment, and works with other monitoring and graphing solutions. That’s where Prometheus and Grafana come in.
Prometheus and Viz
Linkerd Viz is really a front end that displays metrics from a Prometheus data store. This means that all the data that Linkerd supplies and Linkerd Viz displays are available to any visualization, monitoring, or alerting system that uses Prometheus metrics.
Installing Linkerd Viz automatically installs a Prometheus instance, which we’ll use to demonstrate the functionality that Prometheus brings to the table. It’s important to note that you should never use the Prometheus that Linkerd Viz installs in production: it uses volatile storage for its metrics, so every time its Pod restarts, you’ll lose all your historical data. Instead, install your own Prometheus and use that, as described in LInkerd’s documentation.
Prometheus ships with its own dashboard, so we’ll start with that. To view the Prometheus dashboard, use the following command for port forwarding.
kubectl port-forward -n linkerd-viz service/prometheus 9090:9090
Once the port-forward is running, open http://localhost:9090/ to see the Prometheus dashboard. Go to Status (in the upper left of the window) and select Targets from its pulldown:
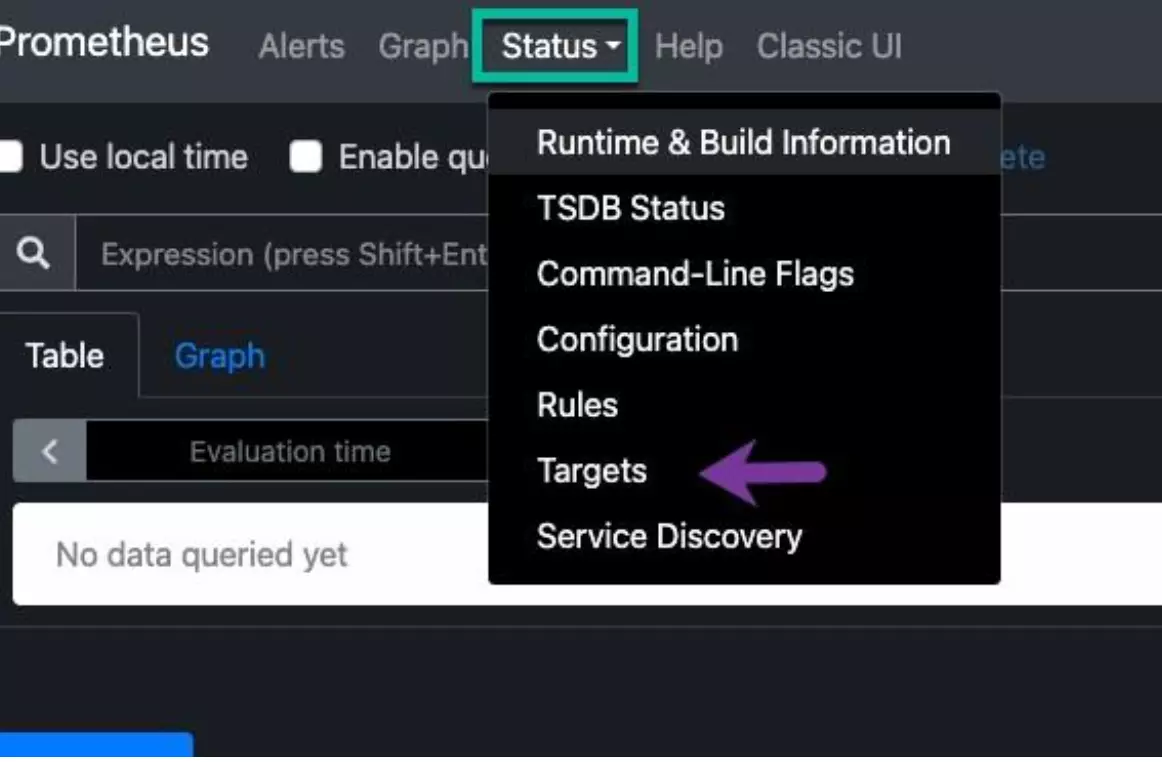
Within the targets, you’ll see that all Linkerd resources are automatically observed via Prometheus. It’ll show the endpoints for metrics, labels, and the endpoint status to ensure it’s up and operational.
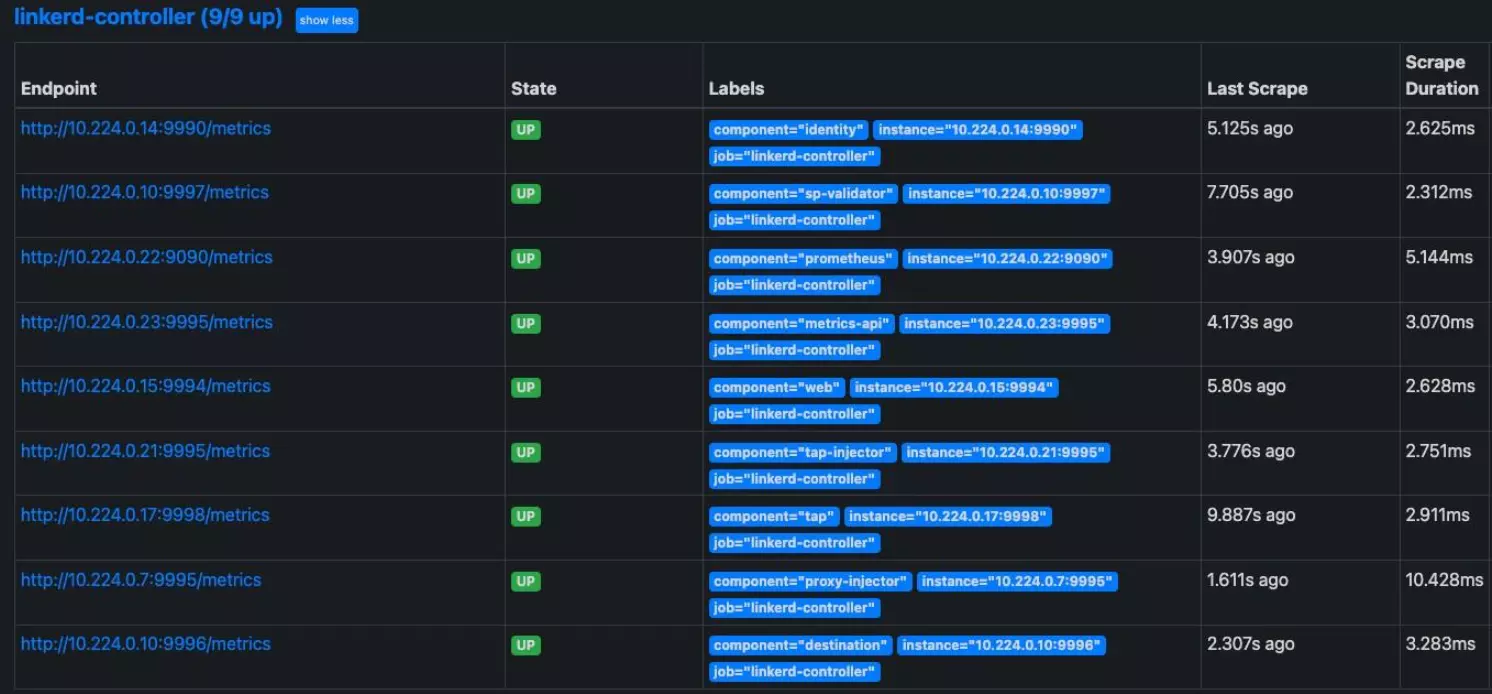
The raw Prometheus dashboard is honestly less useful than the Linkerd Viz dashboard. That’s OK: the real point here is that since we have all this information in Prometheus, we can easily bring any tool based on Prometheus into play – for example, Grafana.
Grafana and Linkerd
Grafana is one of the most popular monitoring UIs in the Kubernetes space, so let’s take a look at it. We’ll install it per Linkerd’s instructions at https://linkerd.io/2/tasks/grafana/:
helm repo add grafana https://grafana.github.io/helm-charts
helm install grafana -n grafana --create-namespace grafana/grafana \
  -f https://raw.githubusercontent.com/linkerd/linkerd2/main/grafana/values.yaml
The values.yaml we’re supplying as input configures Grafana with several default charts published by the Linkerd team at https://grafana.com/orgs/linkerd – we’ll take a look at one of the charts in this article, but you can always refer to the official list for a bit more information.
Done? You should see an similar output to this one:
NAME: grafana
LAST DEPLOYED: Tue Sep  5 17:39:32 2023
NAMESPACE: grafana
STATUS: deployed
REVISION: 1
NOTES:
1. Get your 'admin' user password by running:

   kubectl get secret --namespace grafana grafana -o jsonpath="{.data.admin-password}" | base64 --decode ; echo


2. The Grafana server can be accessed via port 80 on the following DNS name from within your cluster:

   grafana.grafana.svc.cluster.local

   Get the Grafana URL to visit by running these commands in the same shell:
     export POD_NAME=$(kubectl get pods --namespace grafana -l "app.kubernetes.io/name=grafana,app.kubernetes.io/instance=grafana" -o jsonpath="{.items[0].metadata.name}")
     kubectl --namespace grafana port-forward $POD_NAME 3000

3. Login with the password from step 1 and the username: admin
#################################################################################
######   WARNING: Persistence is disabled!!! You will lose your data when   #####
######            the Grafana pod is terminated.                            #####
################################################################################# (PAY CAREFUL ATTENTION to that warning at the bottom! Remember, we’re doing this with the Prometheus installed by Linkerd Viz: you do not want to do that in production, which is why that warning appears.)
Wait a few minutes for the full Grafana installation to be complete. To confirm the installation has been completed, you can use kubectl rollout status again:
kubectl rollout status -n grafana deployments
An additional very important note is that we need to make sure that Grafana has access to its Prometheus instance. If you’re using your own Prometheus instance (as you should!) you’ll need to verify this for your own environment. Since we’re using the one installed by Linkerd Viz, we can install a Linkerd AuthorizationPolicy that allows access from Grafana’s ServiceAccount to the prometheus-admin Server that’s created by Linkerd Viz:
apiVersion: policy.linkerd.io/v1alpha1
kind: AuthorizationPolicy
metadata:
  namespace: linkerd-viz
  name: grafana
spec:
  targetRef:
    group: policy.linkerd.io
    kind: Server
    name: prometheus-admin
  requiredAuthenticationRefs:
    - kind: ServiceAccount
      name: grafana
      namespace: grafana
(This YAML is linked from the docs at https://grafana.com/orgs/linkerd.)
Once that’s done, we should have a functioning Grafana! While you can use port forwarding to get access to the Grafana directly, it’s much simpler to connect it to Linker Viz and just use links shown on the Linkerd Viz dashboard. To make that happen, we’ll rerun linkerd viz install to connect it with Grafana:
linkerd viz install --set grafana.url=grafana.grafana:3000 \
  | kubectl apply -f -
kubectl rollout status -n linkerd-viz deployments
Reload the Linkerd Viz dashboard and go back to the “Namespaces” display. Now you’ll see little Grafana icons on the right of the dashboard:
Click on the Grafana icon at the right of the “sock-shop” namespace and you’ll see a Grafana dashboard showing statistics for that namespace! Though a full discussion of everything Grafana brings to the table is out of scope for this blog, the dashboard is a great way to get a quick overview of how your application is performing.

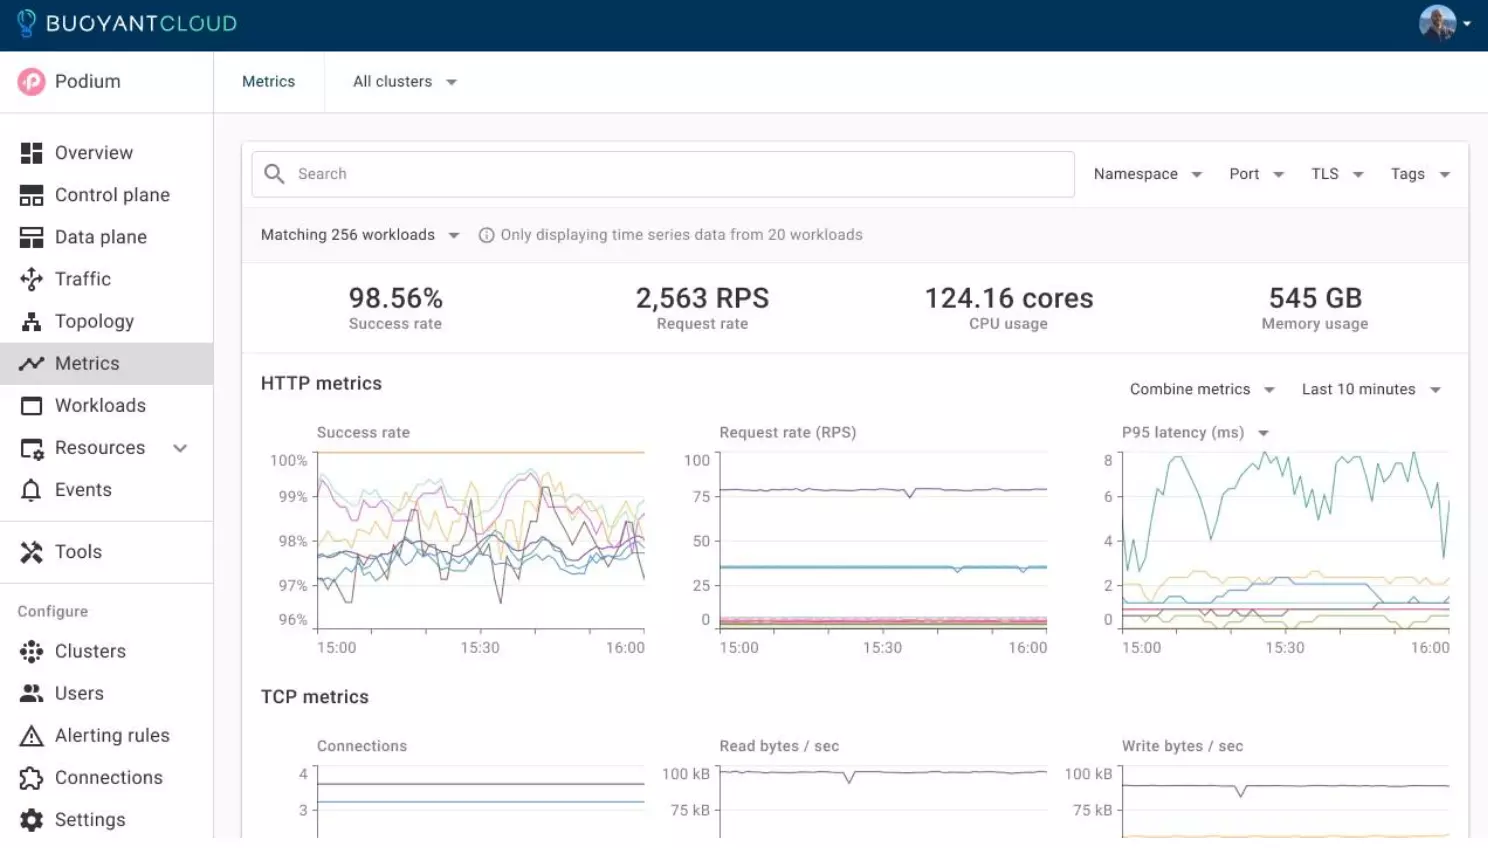
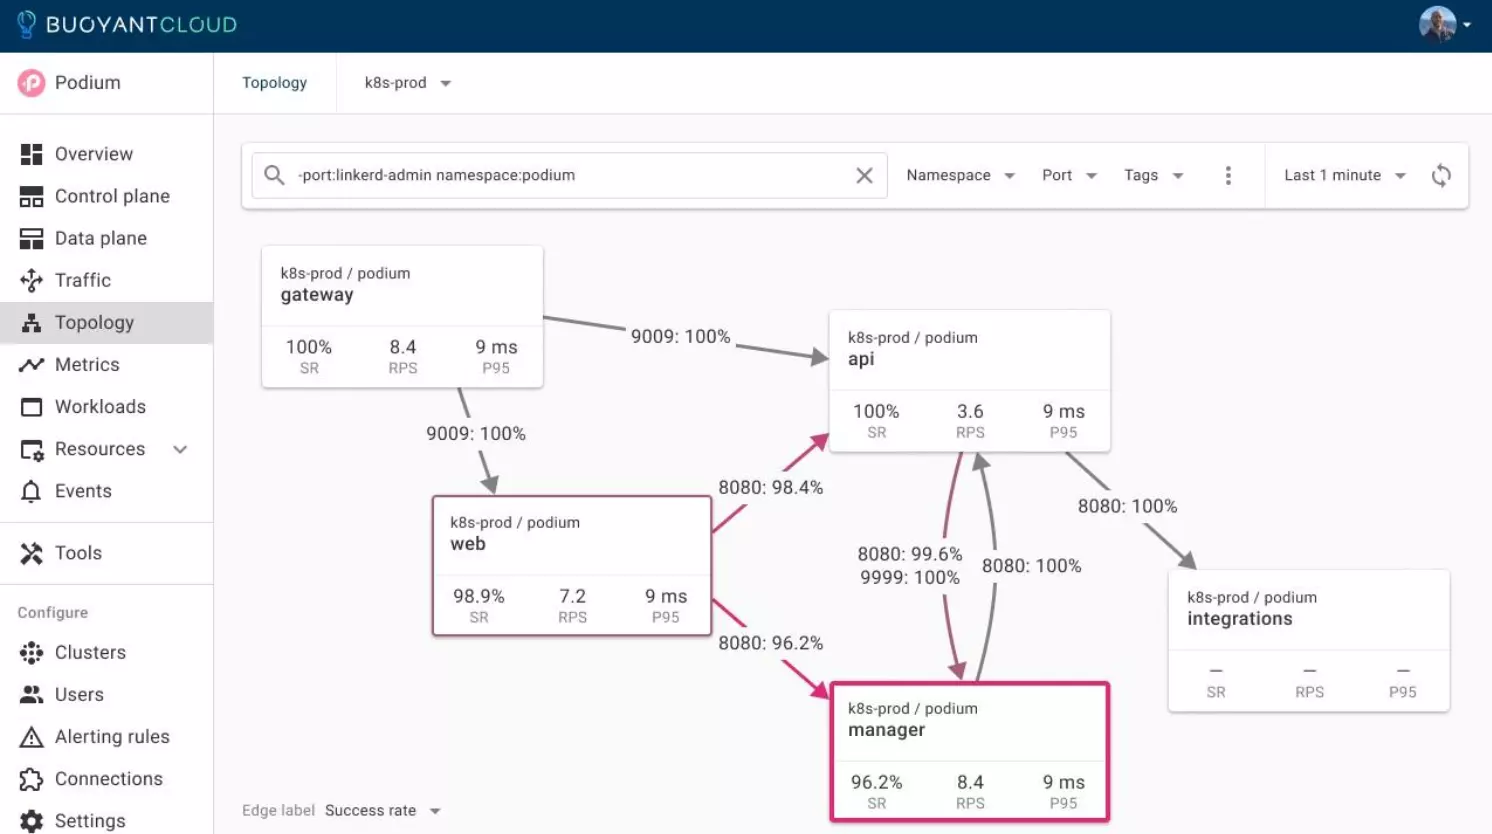
Enhanced monitoring with Buoyant Cloud
There’s also Buoyant Cloud, a paid dashboard from the creators of Linkerd, which automates Linkerd and provides users with deep insights into the health of Linkerd and the behavior of the applications. Its free tier makes it easy to try out (see https://buoyant.io/cloud), It’s fully hosted and can be used by multiple users, and it provides a simple cross-cluster view.
Summing it up
We deployed the Sockshop app, a demo application with multiple microservices, and meshed all services. We used Viz, Linkerd's default application tool, to see application success rate and latency for each service within each pod. Viz is a great tool for dev environments, but if you're running in production, you'll need a more powerful monitoring tool, which is why Linkerd metrics are based on Prometheus: any of the great tools in the Prometheus ecosystem (like Grafana) are straightforward to set up to use Linkerd metrics directly. In our case, we installed Grafana and used the freely-available Linkerd Grafana dashboard to get great visualization easily and quickly. (Just remember: in production, install your own Prometheus instance!)
Prometheus and Grafana give you powerful open-source monitoring tools for your whole environment, and for deeper, cross-cluster data, you can use the free tier of Buoyant Cloud or the paid version for additional enterprise features.