
Kevin Leimkuhler
October 21, 2020
SLOs are a lot easier with a service mesh in hand
In this tutorial, you’ll learn how to easily create service health SLOs on Kubernetes with Prometheus, an open source time-series database, and Linkerd, an open source ultralight service mesh. You’ll see how using a service mesh can solve one of the hardest parts of SLOs: getting consistent metrics for the things you want to measure.
But before we get started, let’s dig into why SLOs and Kubernetes go hand-in-hand.
A case for SLO with Kubernetes and a service mesh
SLOs, or service level objectives, have recently become a popular tool for characterizing application reliability. As described in the Google SRE book, SLOs are a way for application developers and SRE teams to explicitly capture the risk tolerance for their application, by defining what level of failure is acceptable, and then making risk vs reward decisions based on that decision.
For platform owners, who focus less on an application and more on the underlying platforms, SLOs also have another use: they provide a way to understand the health of the services running on the platform without having to know anything about its operational history. This is especially useful in Kubernetes, where you may be running hundreds or thousands of services across dozens of clusters. Rather than needing to understand the operational context of each service, you can use SLOs as a way of getting context-free judgments. (See SLOs vs metrics for Kubernetes.)
Happily, getting SLOs for service health on Kubernetes is a lot easier than you might think. This is because one of the hardest parts of SLOs is getting consistent, uniform metrics, and that’s exactly what a service mesh does! Linkerd, for example, provides a uniform and consistent layer of _golden metrics_—success rates, latencies, request volumes— for all your services, with zero configuration required. With Linkerd’s metrics in hand, getting basic service health SLOs comes down to just doing a little math.
(Of course, a service mesh is not a complete solution to SLOs, as it cannot capture things like application-specific metrics. But for common service health measures like success rate and latency, at least, you will be able to easily build service health SLOs by pulling from service mesh data.)
Let’s get our hands dirty with a demo use case.
Calculating SLOs with Linkerd and Prometheus
In this tutorial, we’re going to see how to set up a basic success rate SLO with a rolling window for a gRPC service running on Kubernetes. Of course, the techniques we use here are just as applicable to different types of metrics and SLOs.
First, let’s review how Linkerd captures its golden metrics. When Linkerd is added to a service, it automatically instruments any HTTP and gRPC calls to and from the pods of the service. It records the response class and latency of those calls and aggregates them in an internal instance of Prometheus. This Prometheus instance powers Linkerd’s dashboard and CLI and contains the observed golden metrics for all meshed services
Thus, to get to our goal, we need to turn the success rate metrics stored in Linkerd’s Prometheus into an SLO.
Setup: Access your Kubernetes cluster and install the Linkerd CLI
Let’s start with the basics. We’ll assume you have a functioning Kubernetes cluster and a kubectl command that points to it. In this section, we’ll walk you through an abbreviated version of the Linkerd Getting Started guide to install Linkerd and a demo application on this cluster.
First, install the Linkerd CLI:
curl -sL https://run.linkerd.io/install | shexport PATH=$PATH:$HOME/.linkerd2/bin(Alternatively, download it directly from the Linkerd releases page.)
Validate that your Kubernetes cluster is able to handle Linkerd; install Linkerd; and validate the installation:
linkerd check --pre
linkerd install | kubectl apply -f -linkerd checkFinally, install the “Emojivoto” demo application that we’ll be working with:
curl -sL https://run.linkerd.io/emojivoto.yml \
  | linkerd inject - \
  | kubectl apply -f -
At this point, we’re ready to get some real metrics. But first, let’s talk about the most important number in an SLO: the error budget.
The error budget
The error budget is arguably the most important part of an SLO. But what is it, exactly, and how do we get one?
Let’s start with an example. Say you’ve decided that your service must have an 80% success rate when measured over the past 7 days. This is our SLO. We can break this statement into three basic components: a service level indicator (SLI), which is our metric; an objective, which is our threshold; and a time window. In this case:
SLI: Success rate of the service
Objective: 80%
Time window: 7 days
This SLO means that 20% of all requests within a 7-day rolling period may fail without us considering it a problem. Our error budget, then, is simply a measure of how much of that 20% we have “consumed” when measured over the time window.
For example, if we served 100% of all responses successfully over the last 7 days, then we have 100% of our error budget remaining—no responses have failed. On the other hand, if we have served 80% of all responses successfully over the last 7 days, then we have 0% of our error budget remaining. And if we’ve served fewer than 80% of successful responses over that period, our error budget would be negative and we’d be in violation of the SLO.
The error budget is calculated with this equation:
Error budget = 1-\[(1-compliance)/(1-objective)\]
Where compliance is your SLI measured over the time window. Thus, in order to calculate your error budget, we measure the SLI over the time window (to compute compliance) and compare that to the objective.
Calculating error budgets with Prometheus
Ok, back to the keyboard. Let’s get access to the Prometheus instance in the Linkerd control plane that we installed in the previous step with a port-forward:
# Get the name of the prometheus pod
$ kubectl -n linkerd get pods
NAME                                      READY   STATUS    RESTARTS   AGE
..
linkerd-prometheus-54dd7dd977-zrgqw       2/2     Running   0          16h
Denoting the name of the pod by PODNAME, we can now do:
>kubectl -n linkerd port-forward linkerd-prometheus-PODNAME 9090:9090We can now open localhost:9090 and begin experimenting with Prometheus’s query language PromQL.

Prometheus dashboard
Complete knowledge of the syntax is not required for this tutorial but browsing through the examples for familiarity will definitely help!
Building our Prometheus queries
In the examples above, 100% and 80% of the responses were successful—this was our compliance number for the time period. Let’s start by calculating that number with a Prometheus query. For our service, we’ll use Emojivoto’s voting service, which sits as a Deployment resource in the emojivoto namespace.
First, let’s figure out how many total responses there are for the voting deployment:
Query:
response_total{deployment="voting", direction="inbound", namespace="emojivoto"}Result:
response_total{classification="success",deployment="voting",direction="inbound",namespace="emojivoto",..} 46499
response_total{classification="failure",deployment="voting",direction="inbound",namespace="emojivoto",..} 8652
Here we see two results because the metrics are separated by the one label value they differ in: classification. We have 46499 successful responses and 8652 failure responses.
Building on that, we can see the number of successful responses at each timestamp for the last 7 days by adding the classification="success" label and [7d] time range:
Query:
response_total{deployment="voting", classification="success", direction="inbound", namespace="emojivoto"}[7d]The response for this query is large, but we can simplify it with the increase() and sum() PromQL functions, grouping by labels to distinguish separate values:
Query:
sum(increase(response_total{deployment="voting", classification="success", direction="inbound", namespace="emojivoto"}[7d])) by (namespace, deployment, classification, tls)Result:
{classification="success",deployment="voting",namespace="emojivoto",tls="true"} 26445.68142198795This means that over the last 7 days there have been around 26445 successful responses by the voting deployment (the decimal comes from the mechanics of the increase() calculation).
Using this, we can now calculate our compliance by dividing this number by the total number responses—just drop the classification="success" label:
Query:
sum(increase(response_total{deployment="voting", classification="success", direction="inbound", namespace="emojivoto"}[7d])) by (namespace, deployment, classification, tls) / ignoring(classification) sum(increase(response_total{deployment="voting", direction="inbound", namespace="emojivoto"}[7d])) by (namespace, deployment, tls)Result:
{deployment="voting",namespace="emojivoto",tls="true"} 0.846113068695625We see that 84.61% of responses over the last 7 days have been successful.
Calculating the error budget
We have the core queries used to calculate the remaining error budget. Now we just need to plug them into the formula above:
Error budget = 1-\[(1-compliance)/(1-objective)\]
Plugging in our objective of 80% (0.8):
Query:
1 - ((1 - (sum(increase(response_total{deployment="voting", classification="success", direction="inbound", namespace="emojivoto"}[7d])) by (namespace, deployment, classification, tls)) / ignoring(classification) sum(increase(response_total{deployment="voting", direction="inbound", namespace="emojivoto"}[7d])) by (namespace, deployment, tls)) / (1 - .80))</code></pre><pre><code class="language-bash">1 - ((1 - (sum(increase(response_total{deployment="voting", classification="success", direction="inbound", namespace="emojivoto"}[7d])) by (namespace, deployment, classification, tls)) / ignoring(classification) sum(increase(response_total{deployment="voting", direction="inbound", namespace="emojivoto"}[7d])) by (namespace, deployment, tls)) / (1 - .80))Result:
{deployment="voting",namespace="emojivoto",tls="true"} 0.2312188519042635In our case, 23.12% of our error budget remains for the voting deployment.
Congratulations, you have successfully computed your first error budget!
Capturing results with Grafana
Numbers are great, but what about fancy graphs? You’re in luck. Linkerd installs a Grafana instance and we can access it locally through Linkerd’s dashboard.
First, load Linkerd’s dashboard by running the linkerd dashboard command.
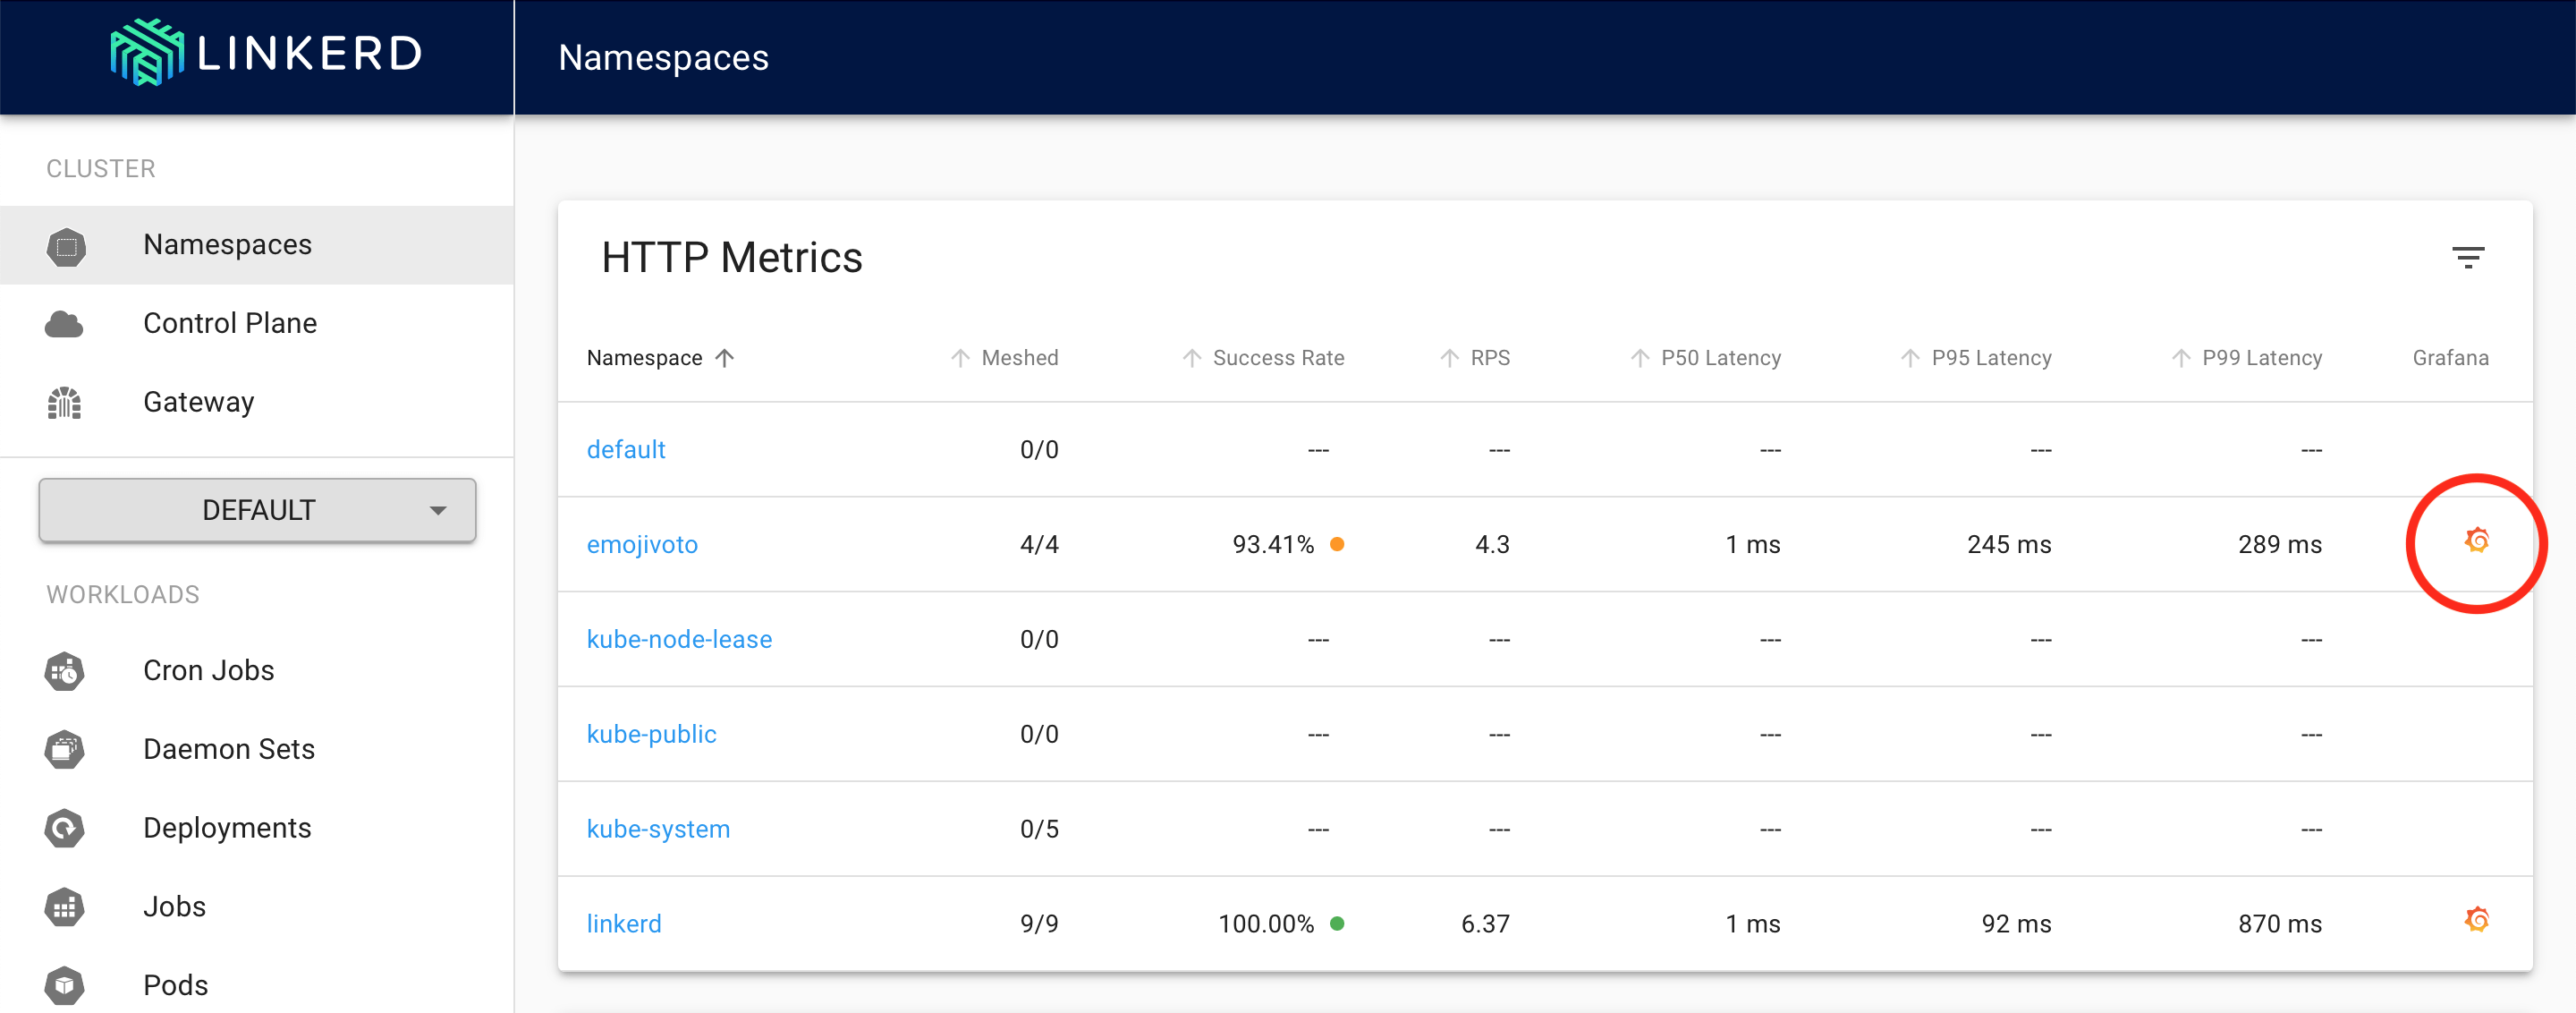
Now, let’s view the Grafana dashboard for the emojivoto namespace by clicking on the corresponding Grafana logo.

Linkerd dashboard with Grafana integration
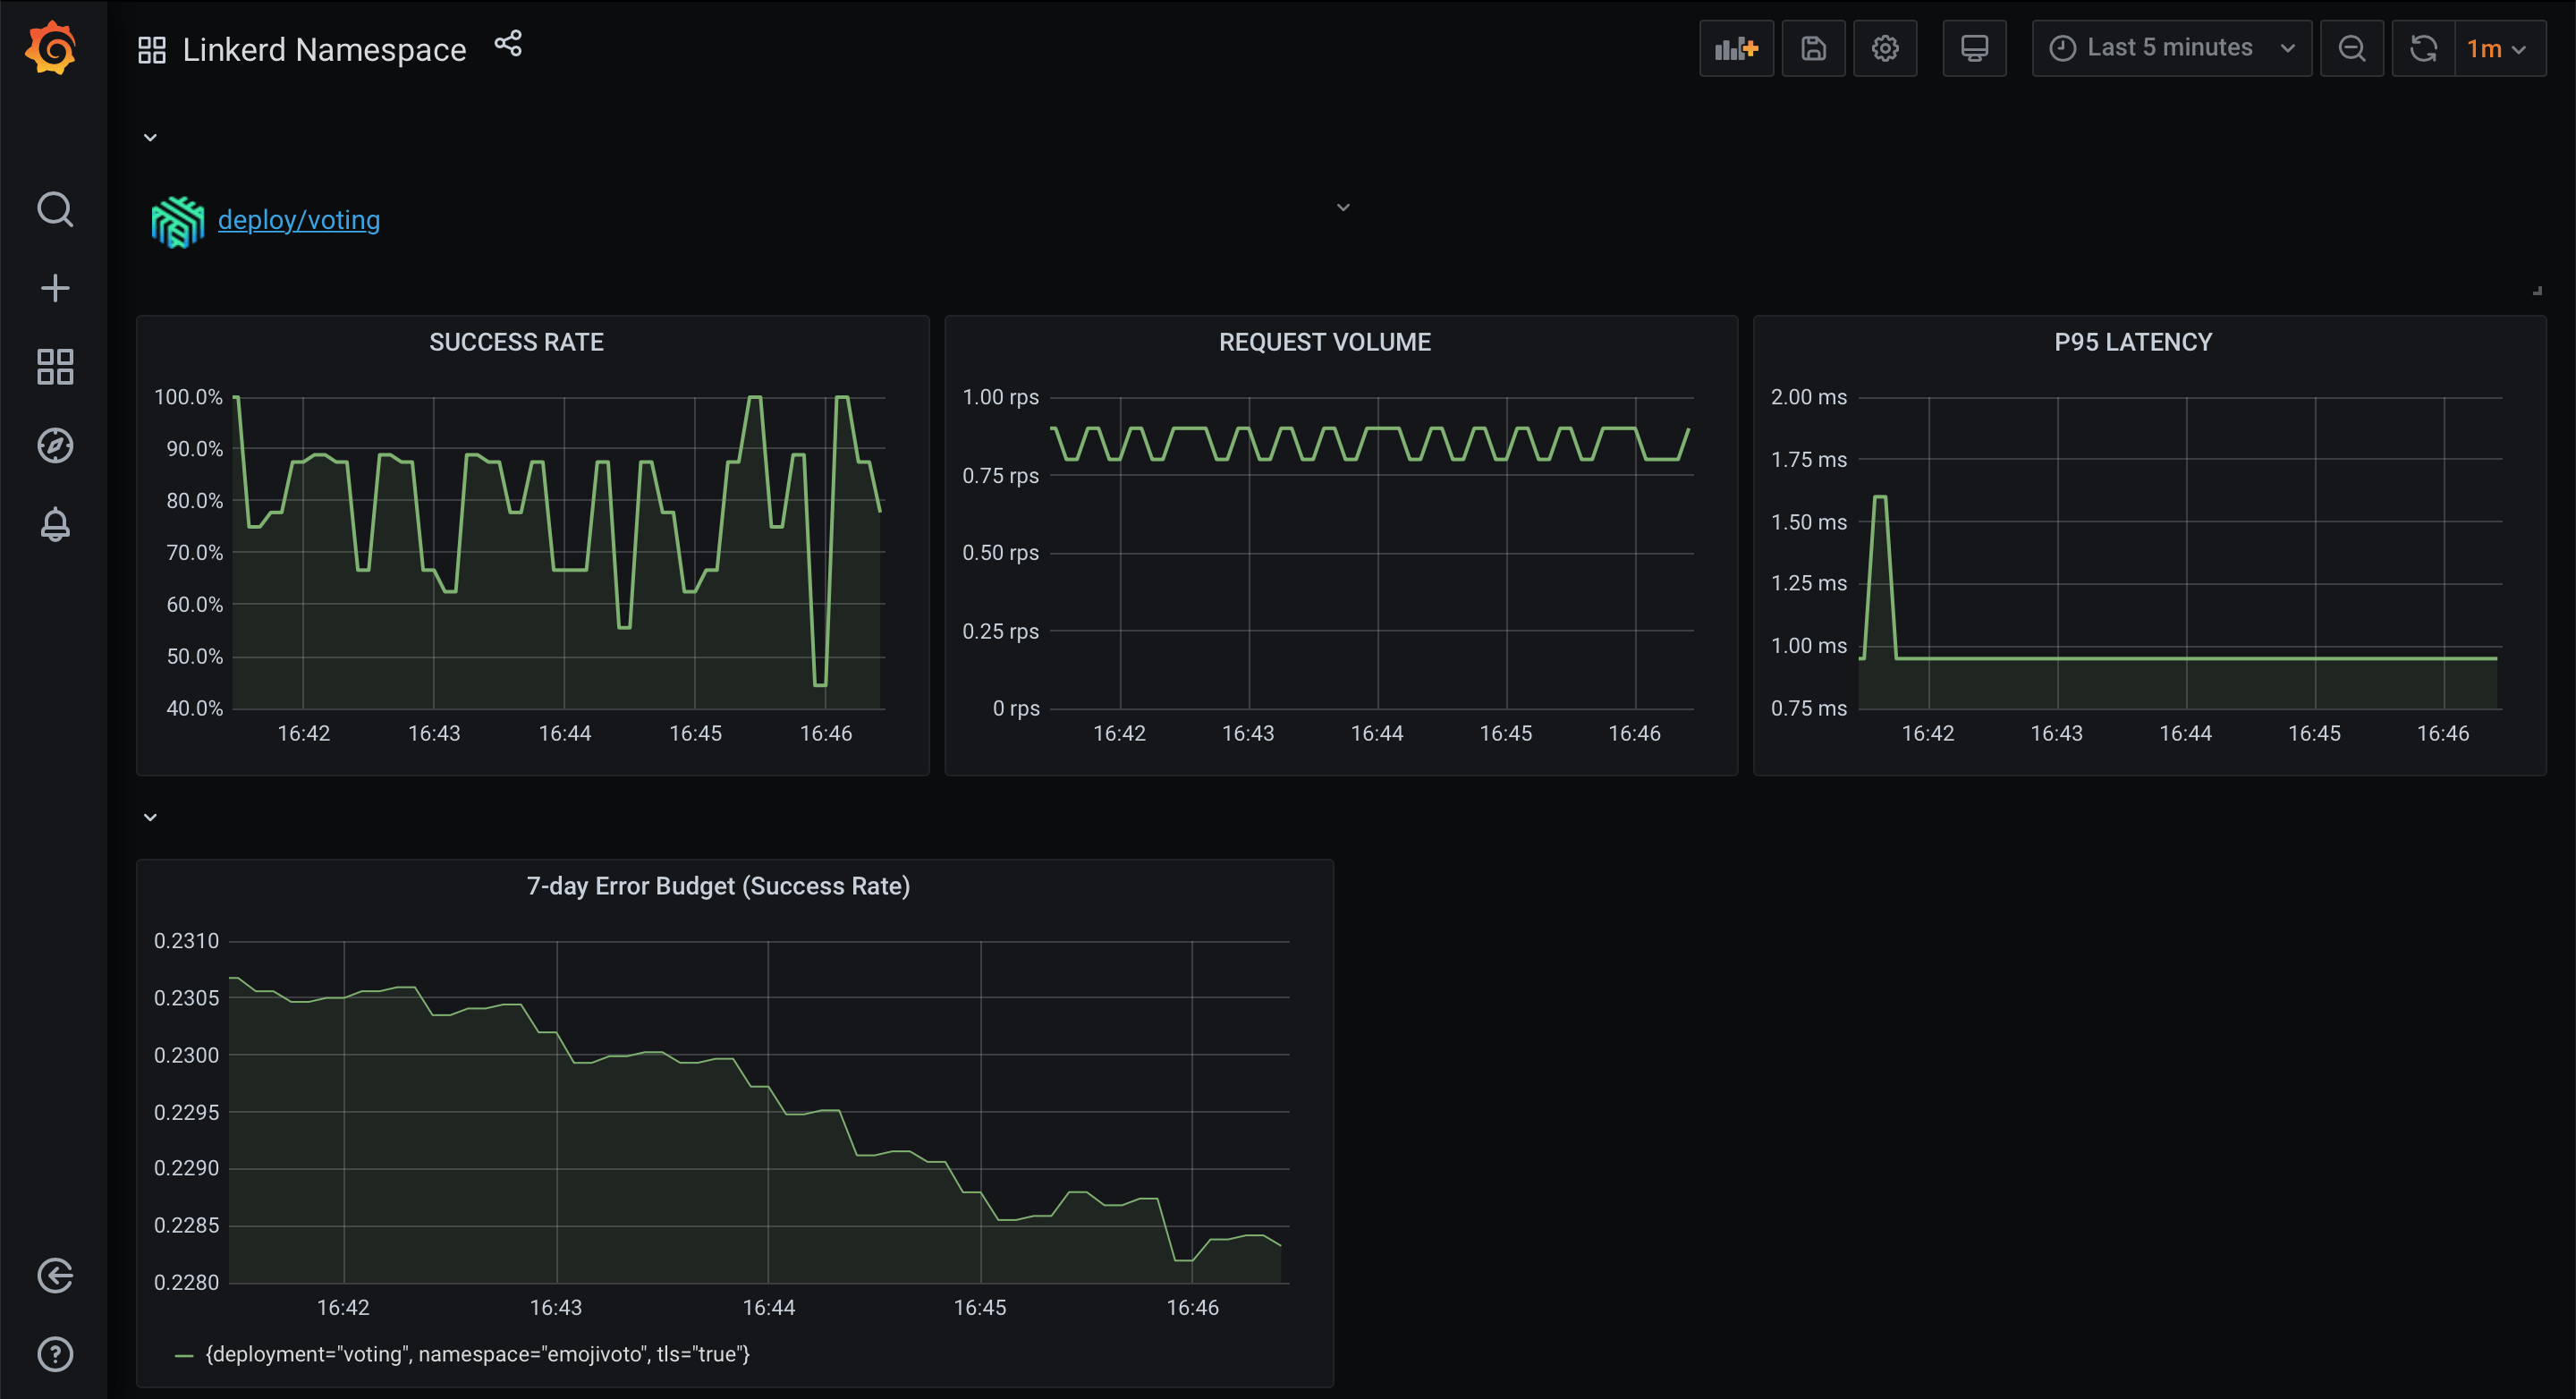
Scrolling down to deploy/voting, we can see panels for the golden metrics: success rates, request rates, and latencies. Let’s add a panel for the remaining error budget.

Linkerd on Grafana dashboard
Keeping it simple, let’s just add the panel title 7-day error budget (success rate) and in the PromQL query box add the final query from above.
Applying the results, you should now have a panel for tracking the remaining error budget of the voting deployment!

Error budget on Grafana with Linkerd metrics.
Taking it further
There are a number of ways to adjust the queries used above to fit a specific use case.
Now that we have a graph tracking the error budget of a service, we can use additional PromQL functions such as rate() to track the error budget burn rate of a service.
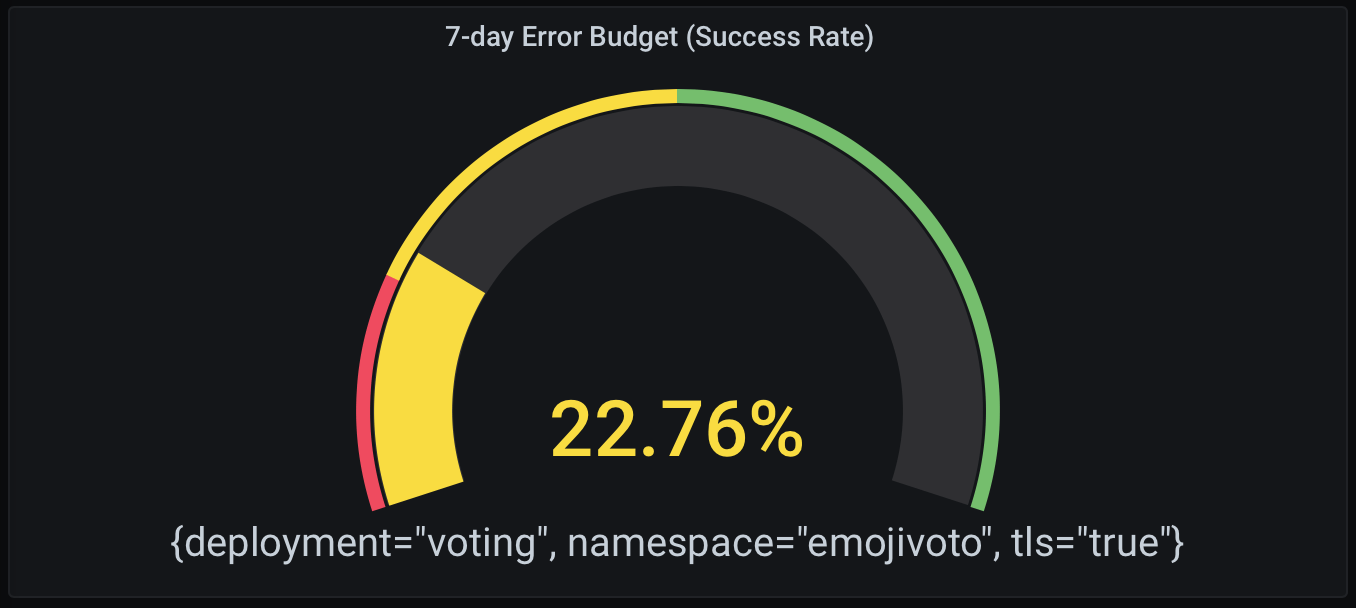
If you want to view your budget differently, try changing the visualization of the data. Here, I have selected Gauge and added thresholds to indicate if I should be concerned or not.

7-day error budget (success rate) with Gauge.
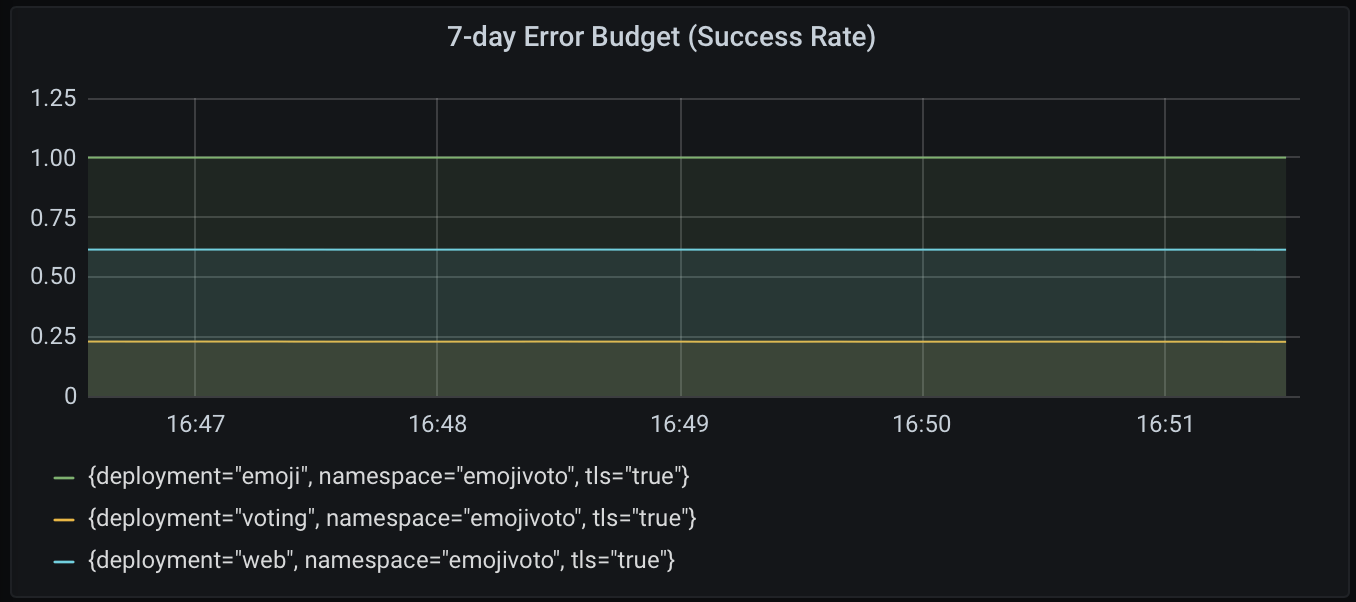
To track the remaining error budgets for all services in the emojivoto namespace, just remove the deployment="voting" label. Keep in mind, this would assume that all the services in the namespace have the same objective of 80%.

7-day error budget (success rate) for all services.
From SLO to actionable observability
You’ve formulated SLOs for service health from Linkerd’s golden metrics, calculated error budgets, and graphed them with Grafana. Congratulations, you’re using SLOs!
So what’s next?
The sad fact of the matter is that even with all of that, there’s still lots of work required to actually put SLOs to use. You’ll need to compute them consistently and uniformly for every relevant service across your platform; you’ll need to get them into the hands of the others in your organization who need to be aware of them; and you’ll need to be able to take action when error budgets start dropping rapidly. Without the rest of this in place, your SLOs will just be empty numbers.
At Buoyant, we’re huge believers in SLOs, especially for Kubernetes. This is part of the reason why we created Buoyant Cloud, which allows you to set up SLOs with the click of a button. Buoyant Cloud builds on Linkerd and uses those same metrics to track all the services running on your cluster automatically. Buoyant Cloud also gives you great shareable dashboards that you can send to the rest of the team, allows you to predict when you’re going to violate your SLOs, and lots of other fancy stuff.
.png)
Buoyant Cloud dashboard showing SLO compliance and error budget over a 7-day window.
Whether you end up using Buoyant Cloud for your Linkerd service health SLOs or sticking with the Prometheus and Grafana approach we outlined above, we wish you good luck on your SLO journey!
Buoyant makes Linkerd awesome
Buoyant is the creator of Linkerd and of Buoyant Cloud, the best way to run Linkerd in mission-critical environments. Today, Buoyant helps companies around the world adopt Linkerd, and provides commercial support for Linkerd as well as training and services. If you’re interested in adopting Linkerd, don’t hesitate to reach out!


 LinkedIn